canvas 简介 canvas是html5的一个标签,代表一个画布,可以在上面进行绘画、动画等操作。画布默认大小是300*150。
canvas标签本省只是画布,要实现上面有文字、线条等呈现,需要使用js实现。总之,画布上一切的呈现,都需要使用js来实现。canvas标签本质上就是一张图片,只是一张空白图片。
画布大小不能使用样式控制,用样式调整的是一个可视区域,其实真实的大小,还是一样的,只是在画布上画内容的话,会等比例放大。调整画布大小,需要在标签上直接添加width和height属性。
canvas标签也是可以放文字的,只是当canvas标签不被浏览器支持的时候,会显示,例如ie8。
初体验 canvas的简单使用:
获取canvas元素
1 var canvas = document .querySelector ('canvas' )
获取这个元素的工具箱 - 上下文
工具箱中包含了很多工具:直线工具、弧形工具、文本工具、矩形工具…… 我们需要依赖这些工具进行绘画
语法:
1 var ctx = canvas.getContext ('2d' )
画图形
默认情况下,canvas选中的工具是直线工具,要画一条直线的话,需要先将画笔放到一个指定像素点
然后以线的形式,将画笔移动到终点:
此时应该已经有线了,但是页面中并没有出现,因为我们前面两个步骤描述的是画笔走的路径,这个路径需要进行填充:
也可以进行描边:
默认是黑色,线的宽度是1px
此时在画布中出现了一条线,但是发现线的粗细不是1px,颜色也不是黑色。
这是因为,canvas绘制线条,会将线条的中心点跟坐标点的位置进行对齐,这样的话,不管是线的开始对准坐标点还是线的结束对准中心点都不合适,所以浏览器干脆将线强行拉伸到 坐标点-1~坐标点+1,也就是本来1px的线,被强制拉伸到了2px,这样的话,颜色也就浅了。
我们可以将线的宽度设置为2px做验证,因为2px就不用被拉伸了:
1 2 ctx.lineWith = 2 ctx.lineTo (200 ,100 )
结果就是2px宽的线,纯黑色了。
基于这个问题,我们以后在绘图的时候,尽量将像素设置为双数。
使用 画多条线: 可以在一个画布中画多条线,但是直接将画笔以线的形式移动到一个位置的时候,是从前面的结束位置,到新的位置画了一条新的线,所以我们需要重新将画笔移动到第二条线的开始位置,然后再以线的形式移动画笔,再次描边。
但是在描第二条边的时候,会再次描第一条边,所以多次描边,前面的线的颜色会越来越深。
我们通常在绘制的时候,会等所有图案绘制结束之后,描一次边,不会描多次。
如果要设置描边的颜色,可以在描边之前设置描边的颜色:
1 ctx.strockStyle = '颜色值' ;
问题:如何给多条线设置不同的宽度和颜色?因为我们在最后描边的时候,发现所有线都是同一个颜色,哪怕给每条线都进行描边,也是一样的结果,说明每条线之间有很大的关联,canvas默认会从上下文上继承颜色和宽度。
我们需要在每次开始绘制的时候,告诉canvas下次的绘制是重新设置,跟上面的没有关系:
画三角形: 三条线回到起点,就是三角形,但是线的结尾和开头部分,进行闭合的时候,其实是缺一个角的。
闭合:
手动闭合,再次画一次开始的线段
自动闭合 - 需要在描边之前闭合
依靠填充的方式闭合:
描边和填充可以一起使用,也可以单独使用,但是都有各自的规则:
描边会把填充的内容扩大
描边的颜色默认是黑色,使用ctx.strokeStyle来设置描边颜色
填充的颜色默认是黑色,使用ctx.fillStyle来设置填充颜色
画填充回形: 需求:
大正方形:200 * 200;小正方形:100 * 100;出现在画布的最中心;线宽2;
获取画布的宽度和高度:
1 2 ctx.canvas .width ctx.canvas .height
通过线段描边,得到两个正方形,填充规则 - 非零填充规则:
在任何一个填充的区域,向外(到外围canvas的区域)拉一条线,数数经过了几个顺时针和逆时针进行计算:
顺时针+1,逆时针-1
最后得到的数字不是0,就填充;是0,就不填充
线段两端的样式: 线段和线段交接处的样式: 画虚线: 需要在绘制线条之前,设置线条的样式为虚线:
1 2 3 4 5 6 7 8 9 10 11 12 ctx.setLineDash (参数);
获取虚线的方案:
练习:利用循环画纯色渐变的线条:
1 2 3 4 5 6 7 8 9 ctx.lineWidth = 10 for (var i=0 ;i<256 ;i++){ ctx.beginPath () ctx.moveTo (100 +i,100 ) ctx.lineTo (100 +i+1 ,100 ) ctx.strokeStyle = `rgb(255,${255 -i} ,${255 -i} )` ctx.closePath () ctx.stroke () }
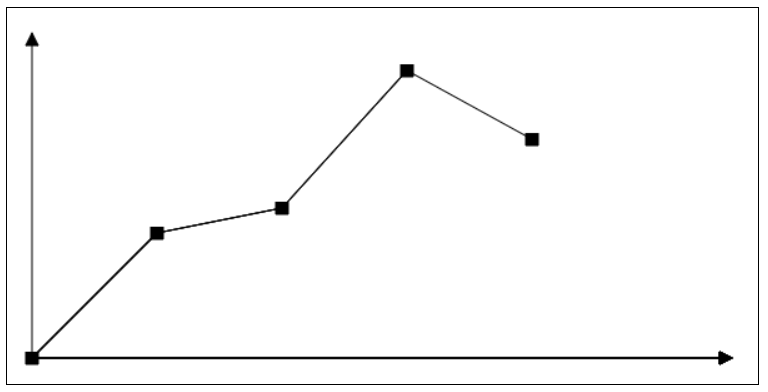
画折线图
html
1 2 3 4 5 6 <style > canvas { border :1px solid #000 ; } </style > <canvas width =600 height =300 > </canvas >
js
1 2 3 4 5 6 7 8 9 10 11 12 13 14 15 16 17 18 19 20 21 22 23 24 25 26 27 28 29 30 31 32 33 34 35 36 37 38 39 40 41 42 43 44 45 46 47 48 49 50 51 52 53 54 55 56 57 58 59 60 61 62 63 64 65 66 67 68 69 70 71 72 73 74 75 76 77 78 79 80 81 82 83 84 85 86 87 88 89 var canvas = document .querySelector ('canvas' );var ctx = canvas.getContext ('2d' );function setPoint (pointData ){ ctx.beginPath () ctx.moveTo (pointData.x - 5 ,pointData.y - 5 ) ctx.lineTo (pointData.x - 5 ,pointData.y + 5 ) ctx.lineTo (pointData.x + 5 ,pointData.y + 5 ) ctx.lineTo (pointData.x + 5 ,pointData.y - 5 ) ctx.stroke () ctx.fill () } function setPoints (pointsData ){ pointsData.forEach (v => setPoint (v) }) } var pointsData = [ { x :20 , y :280 }, { x :120 , y :180 }, { x :220 , y :160 }, { x :320 , y :50 }, { x :420 , y :105 } ] setPoints (pointsData)var space = 20 ;var width = ctx.canvas .width var height = ctx.canvas .height function setAxiosX ( var pointX = space; var pointY = height - space; var endX = space; var endY = space; ctx.beginPath () ctx.moveTo (pointX,pointY) ctx.lineTo (endX,endY) ctx.lineTo (endX-5 ,endY+10 ) ctx.lineTo (endX+5 ,endY+10 ) ctx.lineTo (endX,endY) ctx.stroke () ctx.fill () } setAxiosX ()function setAxiosY ( var pointX = space; var pointY = height - space; var endX = width-space; var endY = height - space; ctx.beginPath () ctx.moveTo (pointX,pointY) ctx.lineTo (endX,endY) ctx.lineTo (endX-10 ,endY-5 ) ctx.lineTo (endX-10 ,endY+5 ) ctx.lineTo (endX,endY) ctx.stroke () ctx.fill () } setAxiosY ()function connectPoints (pointsData ){ for (var i=0 ;i<pointsData.length -1 ;i++){ ctx.moveTo (pointsData[i].x ,pointsData[i].y ) ctx.lineTo (pointsData[i+1 ].x ,pointsData[i+1 ].y ) ctx.stroke () } } connectPoints (pointsData)
面向对象改造。
1 2 3 4 5 6 7 8 9 10 11 12 13 14 15 16 17 18 19 20 21 22 23 24 25 26 27 28 29 30 31 32 33 34 35 36 37 38 39 40 41 42 43 44 45 46 47 48 49 50 51 52 53 54 55 56 57 58 59 60 61 62 63 64 65 66 67 68 69 70 71 72 73 74 75 76 77 78 79 80 81 82 83 84 85 86 87 88 89 90 91 92 93 94 95 96 97 98 99 100 101 102 103 104 105 106 107 108 109 110 111 112 113 114 115 116 117 118 119 120 121 122 123 124 125 126 127 128 129 130 131 132 133 134 135 136 137 138 139 140 141 142 143 class LineChart { constructor (classname,data ){ this .canvas = document .querySelector ('.' +classname) this .ctx = this .canvas .getContext ('2d' ) this .canvasWidth = this .ctx .canvas .width this .canvasHeight = this .ctx .canvas .height this .space = 20 this .originX = 0 this .originY = 0 this .length = 10 this .data = data this .canvasData = null ; } init ( this .getOrigin () this .createAxisX () this .createAxisY () this .convert (this .data ) this .setPoints (this .canvasData ) this .connectLine (this .canvasData ) } connectLine (data ){ for (let i=0 ;i<data.length -1 ;i++){ this .ctx .beginPath () this .ctx .moveTo (data[i].x ,data[i].y ) this .ctx .lineTo (data[i+1 ].x ,data[i+1 ].y ) this .ctx .closePath () this .ctx .stroke () } } setPoints (data ){ data.forEach (point => this .setPoint (point) }) } setPoint (data ){ this .ctx .beginPath () this .ctx .moveTo (data.x -this .length /2 ,data.y -this .length /2 ) this .ctx .lineTo (data.x +this .length /2 ,data.y -this .length /2 ) this .ctx .lineTo (data.x +this .length /2 ,data.y +this .length /2 ) this .ctx .lineTo (data.x -this .length /2 ,data.y +this .length /2 ) this .ctx .lineTo (data.x -this .length /2 ,data.y -this .length /2 ) this .ctx .closePath () this .ctx .stroke () this .ctx .fill () } convert ( this .canvasData = this .data .map (point => return { x :point.x +this .space , y :this .canvasHeight - this .space - point.y } }) } createAxisY ( this .ctx .beginPath () this .ctx .moveTo (this .originX ,this .originY ) this .ctx .lineTo (this .originX ,this .space ) this .ctx .lineTo (this .originX -this .length /2 ,this .space + this .length ) this .ctx .lineTo (this .originX +this .length /2 ,this .space + this .length ) this .ctx .lineTo (this .originX ,this .space ) this .ctx .closePath () this .ctx .stroke () this .ctx .fill () } getOrigin ( this .originX = this .space ; this .originY = this .canvasHeight - this .space } createAxisX ( this .ctx .beginPath () this .ctx .moveTo (this .originX ,this .originY ) this .ctx .lineTo (this .canvasWidth - this .space ,this .originY ) this .ctx .lineTo (this .canvasWidth -this .space -this .length ,this .originY -this .length /2 ) this .ctx .lineTo (this .canvasWidth -this .space -this .length ,this .originY +this .length /2 ) this .ctx .lineTo (this .canvasWidth - this .space ,this .originY ) this .ctx .closePath () this .ctx .stroke () this .ctx .fill () } } var lc = new LineChart ('linechart' ,[ { x :0 , y :0 }, { x :100 , y :100 }, { x :200 , y :120 }, { x :300 , y :220 }, { x :400 , y :150 }, ]) console .log (lc);lc.init ()
画矩形: 矩形需要设置起点和矩形的宽和高:
然后进行描边或填充。
直接进行绘制矩形并描边:
1 ctx.strokeRect (起点x,起点y,宽,高)
直接绘制矩形并填充:
1 ctx.fillRect (起点x,起点y,宽,高)
当进行多个矩形填充不同颜色的时候,不需要结束路径,因为绘制矩形没有开启新的路径,绘制形状互相是独立的。
清除矩形:
清除矩形是将指定范围内的东西都清除掉
1 ctx.clearRect (起点x,起点y,宽,高)
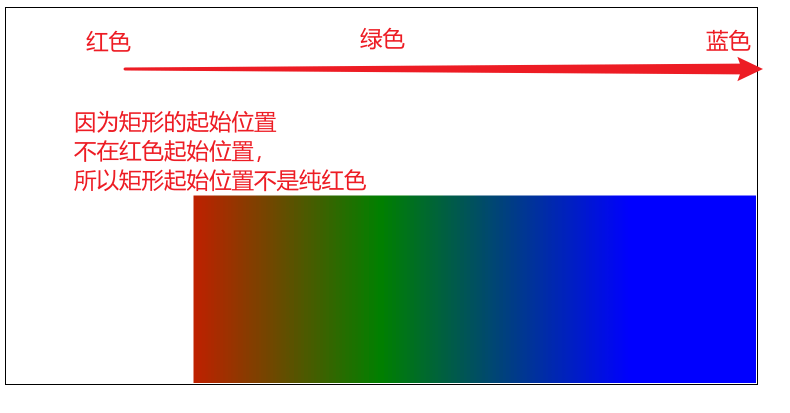
渐变: 设置颜色的时候是可以设置渐变的。渐变跟形状无关,在画布中确定好渐变的区域和颜色之后,在这个区域内的图形,填充或描边时可以将颜色设置成渐变。
设置渐变方案:
1 ctx.createLinearGradient (开始x,开始y,结束x,结束y)
通过设置的初始值和结束值可以确定渐变的方向。
设置渐变颜色:
1 2 3 4 5 渐变方案.addColorStop (数字,颜色)
渐变方案可以直接赋值给填充或描边颜色的,例:
1 2 3 4 5 6 7 8 9 10 var linearGradient = ctx.createLinearGradient (100 ,100 ,500 ,100 );linearGradient.addColorStop (0 ,'red' ); linearGradient.addColorStop (0.5 ,'green' ); linearGradient.addColorStop (1 ,'blue' ); ctx.fillStyle = linearGradient; ctx.fillRect (150 ,150 ,500 ,200 )
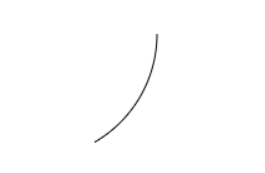
画弧线: 画弧线是画一个路径,后面需要填充或描边。
1 ctx.arc (圆心x,圆心y,半径,开始弧度,结束弧度)
弧度:当圆形上的边跟半径相等的时候就是一个弧长,弧度其实就是弧长的个数。
我们通常描述的时候,会使用角度来描述弧形,很少描述弧度,但是计算机在计算的时候使用弧度的时候比较多。
弧度和角度的换算:
1 2 3 4 5 6 7 周长 = π * 半径 * 2 一周长是360 度,1 弧长是半径,所以: 1 弧长对应的角度 = 180 / π新角度/计算出来的角度 = 新弧长 / 1 弧长 新弧长 = 1 弧长 * 新角度 / 计算出来的角度 新弧长 = r * 60 * π / 180 弧度 = 角度 * π / 180
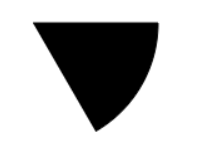
横向x轴向右的角度是0度,顺时针是正角度,所以画一个0度到60度的弧形:
1 2 3 4 ctx.arc (100 ,100 ,100 ,0 ,60 * Math .PI /180 ) ctx.stroke () ctx.fill ()
将这个弧形和半径进行填充就能得到一个扇形。
1 2 3 4 ctx.moveTo (100 ,100 ) ctx.arc (100 ,100 ,100 ,0 ,Math .PI /3 ) ctx.stroke () ctx.fill ()
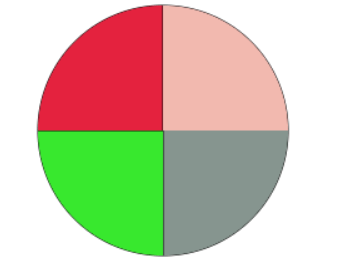
等分圆形: 1 2 3 4 5 6 7 8 9 10 11 12 13 14 15 16 17 18 19 20 21 22 23 24 var width = ctx.canvas .width ;var height = ctx.canvas .height var pointX = width / 2 ;var pointY = height / 2 ;var r = 100 ;var num = 4 ;var startArc = 0 ;for (var i=0 ;i<num;i++){ ctx.beginPath () ctx.moveTo (pointX,pointY) ctx.fillStyle = getColor () ctx.arc (pointX,pointY,r,startArc,(i+1 )*360 /num*Math .PI /180 ) ctx.stroke () ctx.fill () startArc = (i+1 )*360 /num*Math .PI /180 } function getColor ( var r = Math .floor (Math .random ()*256 ); var g = Math .floor (Math .random ()*256 ); var b = Math .floor (Math .random ()*256 ); return `rgb(${r} ,${g} ,${b} )` }
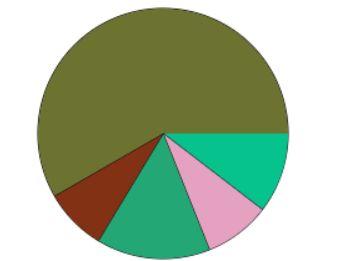
画饼图: 已知数据:
15 ~ 20 岁, 22 人
将数据抽象出来成一个数组:
每个数据对应的弧长:
1 2 角度:(数据 / 总和) * 360 弧度:角度 * Math.PI / 180
代码:
1 2 3 4 5 6 7 8 9 10 11 12 13 14 15 16 17 18 19 20 21 22 23 24 25 26 27 28 var arr = [22 ,18 ,31 ,17 ,123 ]var canvas = document .querySelector ('canvas' );var ctx = canvas.getContext ('2d' )var width = ctx.canvas .width ;var height = ctx.canvas .height ;var pointX = width / 2 ;var pointY = height / 2 ;var r = 100 ;var sum = arr.reduce ((a,b )=> a+b)var startArc = 0 arr.forEach (v => var endArc = startArc + v/sum * 360 * Math .PI /180 ctx.beginPath () ctx.moveTo (pointX,pointY); ctx.fillStyle = getColor () ctx.arc (pointX,pointY,r,startArc,endArc) ctx.stroke () ctx.fill () startArc = endArc }) function getColor ( var r = Math .floor (Math .random ()*256 ); var g = Math .floor (Math .random ()*256 ); var b = Math .floor (Math .random ()*256 ); return `rgb(${r} ,${g} ,${b} )` }
画文字: 1 2 ctx.strokeText (文本,文字开始x,文字开始y) ctx.fillText (文本,文字开始x,文字开始y)
例:
文字大小:
上下对齐方式:
1 2 3 4 5 6 7 8 ctx.textBaseLine = 值;
左右对齐方式:
获取文本内容的总宽度:
练习:
面向过程代码
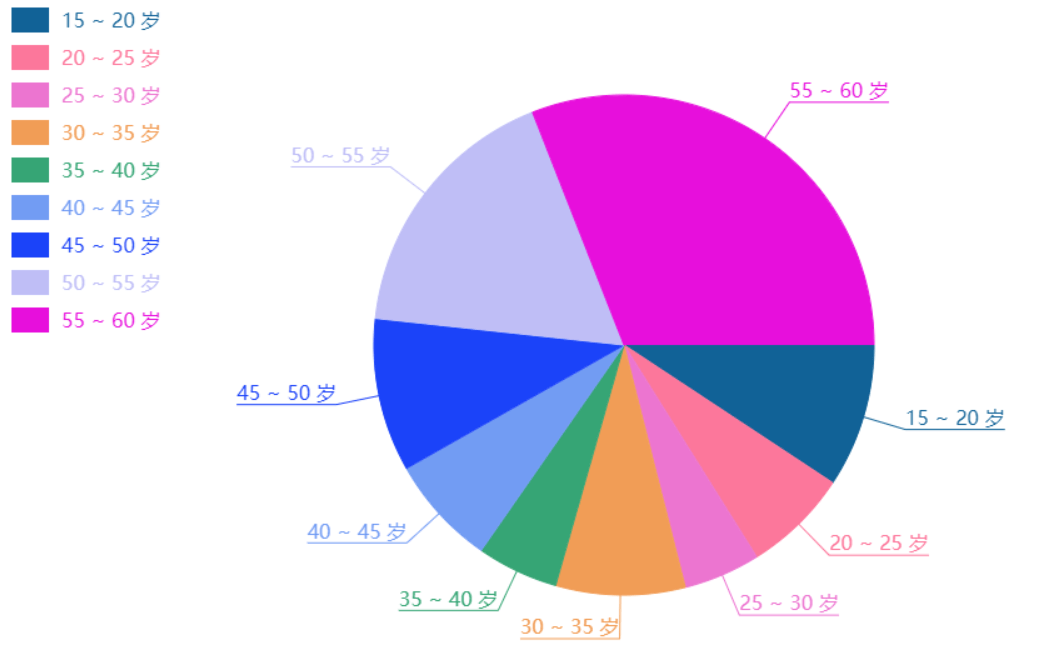
1 2 3 4 5 6 7 8 9 10 11 12 13 14 15 16 17 18 19 20 21 22 23 24 25 26 27 28 29 30 31 32 33 34 35 36 37 38 39 40 41 42 43 44 45 46 47 48 49 50 51 52 53 54 55 56 57 58 59 60 61 62 63 64 65 66 67 68 69 70 71 72 73 74 75 76 77 78 79 80 81 82 83 84 85 86 87 88 89 90 91 92 93 94 95 96 97 98 99 100 101 102 103 104 105 106 107 108 109 110 111 112 113 114 115 116 117 118 119 120 121 122 123 124 125 126 127 128 129 130 131 var canvas = document .querySelector ('canvas' )var ctx = canvas.getContext ('2d' );var x = ctx.canvas .width / 2 + 200 ;var y = ctx.canvas .height / 2 ;var r = 150 var R = r + 40 var data = [ { title :"15 ~ 20 岁" , num :20 }, { title :"20 ~ 25 岁" , num :15 }, { title :"25 ~ 30 岁" , num :10 }, { title :"30 ~ 35 岁" , num :35 }, { title :"35 ~ 40 岁" , num :12 }, { title :"40 ~ 45 岁" , num :25 }, { title :"45 ~ 50 岁" , num :30 }, { title :"50 ~ 55 岁" , num :35 }, { title :"55 ~ 60 岁" , num :50 } ]; var startNum = data[0 ].num var total = data.reduce ((a,b )=> { if (typeof a === 'number' ){ return a + b.num }else { return startNum + b.num } }) data.forEach (v => v.arc = v.num /total*2 * Math .PI }) var startArc = 0 data.forEach ((v,index )=> { ctx.beginPath () ctx.moveTo (x,y) var endArc = startArc + v.arc ctx.arc (x,y,r,startArc,endArc) startArc = endArc var color = getColor () ctx.fillStyle = color ctx.fill () outLine (v.arc ,endArc,color,v.title ) descSquare (index) }) function descSquare (index ){ var squareWidth = 50 ; var squareHeight = 30 ; var squareLeft = 20 ; var squareTop = 20 ctx.fillRect (squareLeft,squareTop*(index+1 )+squareHeight*index,squareWidth,squareHeight) var textX = squareLeft + squareWidth + squareLeft var textY = squareTop*(index+1 )+squareHeight*index+squareHeight/2 ctx.textBaseline = 'middle' ; ctx.textAlign = 'left' ; var percent = (data[index].num / total).toFixed (2 ) * 100 + '%' ctx.fillText (data[index].title +' ' + percent,textX,textY) } function outLine (currentArc,endArc,color,title ){ var arc = endArc - currentArc/2 var endX = Math .cos (arc) * R + x var endY = Math .sin (arc) * R + y ctx.moveTo (x,y) ctx.lineTo (endX,endY) ctx.strokeStyle = color ctx.font = '16px 楷体' var textWidth = ctx.measureText (title).width if (endX<x){ textX = endX - textWidth ctx.textAlign = 'left' ; }else { textX = endX + textWidth ctx.textAlign = 'right' ; } ctx.textBaseline = 'bottom' ; ctx.lineTo (textX,endY) ctx.strokeText (title,textX,endY-3 ) ctx.stroke () } function getColor ( return `rgb(${Math .floor(Math .random()*256 )} ,${Math .floor(Math .random()*256 )} ,${Math .floor(Math .random()*256 )} )` }
面向对象代码
1 2 3 4 5 6 7 8 9 10 11 12 13 14 15 16 17 18 19 20 21 22 23 24 25 26 27 28 29 30 31 32 33 34 35 36 37 38 39 40 41 42 43 44 45 46 47 48 49 50 51 52 53 54 55 56 57 58 59 60 61 62 63 64 65 66 67 68 69 70 71 72 73 74 75 76 77 78 79 80 81 82 83 84 85 86 87 88 89 90 91 92 93 94 95 96 97 98 99 100 101 102 103 104 105 106 107 108 109 110 111 112 113 114 115 116 117 118 119 120 121 122 123 124 125 126 127 128 129 130 131 132 133 134 135 136 137 138 139 140 141 142 143 144 145 146 147 148 class Pie { constructor (classname,data ){ this .data = data this .canvas = document .querySelector ('.' +classname) this .ctx = this .canvas .getContext ('2d' ); this .x = this .ctx .canvas .width / 2 + 200 ; this .y = this .ctx .canvas .height / 2 ; this .r = 150 this .R = this .r + 40 this .total = this .data .reduce ((a,b )=> { if (typeof a === 'number' ){ return a + b.num }else { return this .data [0 ].num + b.num } }) } init ( this .convertData () this .drawPie () } convertData ( this .data .forEach (v => v.arc = v.num /this .total *2 * Math .PI }) } drawPie ( var startArc = 0 this .data .forEach ((v,index )=> { this .ctx .beginPath () this .ctx .moveTo (this .x ,this .y ) var endArc = startArc + v.arc this .ctx .arc (this .x ,this .y ,this .r ,startArc,endArc) startArc = endArc var color = this .getColor () this .ctx .fillStyle = color this .ctx .fill () this .outLine (v.arc ,endArc,color,v.title ) this .descSquare (index) }) } descSquare (index ){ var squareWidth = 50 ; var squareHeight = 30 ; var squareLeft = 20 ; var squareTop = 20 this .ctx .fillRect (squareLeft,squareTop*(index+1 )+squareHeight*index,squareWidth,squareHeight) var textX = squareLeft + squareWidth + squareLeft var textY = squareTop*(index+1 )+squareHeight*index+squareHeight/2 this .ctx .textBaseline = 'middle' ; this .ctx .textAlign = 'left' ; var percent = (this .data [index].num / this .total ).toFixed (2 ) * 100 + '%' this .ctx .fillText (this .data [index].title +' ' + percent,textX,textY) } outLine (currentArc,endArc,color,title ){ var arc = endArc - currentArc/2 var endX = Math .cos (arc) * this .R + this .x var endY = Math .sin (arc) * this .R + this .y this .ctx .moveTo (this .x ,this .y ) this .ctx .lineTo (endX,endY) this .ctx .strokeStyle = color this .ctx .font = '16px 楷体' var textWidth = this .ctx .measureText (title).width if (endX<this .x ){ var textX = endX - textWidth this .ctx .textAlign = 'left' ; }else { var textX = endX + textWidth this .ctx .textAlign = 'right' ; } this .ctx .textBaseline = 'bottom' ; this .ctx .lineTo (textX,endY) this .ctx .strokeText (title,textX,endY-3 ) this .ctx .stroke () } getColor ( return `rgb(${Math .floor(Math .random()*256 )} ,${Math .floor(Math .random()*256 )} ,${Math .floor(Math .random()*256 )} )` } } var data = [ { title :"15 ~ 20 岁" , num :20 }, { title :"20 ~ 25 岁" , num :15 }, { title :"25 ~ 30 岁" , num :10 }, { title :"30 ~ 35 岁" , num :35 }, { title :"35 ~ 40 岁" , num :12 }, { title :"40 ~ 45 岁" , num :25 }, { title :"45 ~ 50 岁" , num :30 }, { title :"50 ~ 55 岁" , num :35 }, { title :"55 ~ 60 岁" , num :50 } ]; var pie = new Pie ('pie' ,data)pie.init ()


 微信
微信 支付宝
支付宝